Kaggle
백혈구(White Blood Cell)의 종류를 분류하기 위한 데이터셋
종류는 총 4가지 종류가 있다.
- NEUTROPHIL : 호중구
- EOSINOPHIL : 호산구
- MONOCYTE : 단핵구
- LYMPHOCYTE : 림프구
kaggle에서는 classification datasets은 잘 구성이 되어있다. white blood cell detection을 위한 데이터셋은 여기서 구해 이용할 수 있다.
Environment
kaggle notebook도 쉽게 이용할 수 있지만 환경은 Colab으로 진행한다.
Source Code
library
1
2
3
4
5
6
7
8
9
10
11
| import numpy as np
import os
import cv2
import math
import matplotlib.pyplot as plt
from keras.optimizers import Adam
from keras.preprocessing.image import ImageDataGenerator
from keras.layers import Input, Activation, Dense, Conv2D, Reshape, concatenate, \
BatchNormalization, MaxPooling2D, GlobalAveragePooling2D
from keras.callbacks import LearningRateScheduler
|
DataSets
1
2
3
4
5
6
7
8
9
10
11
12
13
14
15
16
17
18
19
20
21
22
| img_path = './dataset2-master/dataset2-master/images'
train_img_path = os.path.join(img_path, 'TRAIN')
test_img_path = os.path.join(img_path, 'TEST')
test_simple_img_path = os.path.join(img_path,'TEST_SIMPLE')
classes = os.listdir(train_img_path)
print('classes : ', classes)
plt.figure(figsize=(20,20))
for i,cls in enumerate(classes):
plt.subplot(1, 5, i+1)
plt.title(cls)
plt.axis('off')
path=os.path.join(train_img_path, cls)
img_path=os.listdir(path)[0]
img = cv2.imread(os.path.join(path, img_path))
img = cv2.cvtColor(img, cv2.COLOR_BGR2RGB)
plt.imshow(img)
|
hyper parameter
1
2
3
| image_shape=[128,128,3]
batch_size=64
epochs=100
|
learning rate값을 정의해야하지만 뒤에 learning rate decay를 scheduler로 진행하기 위해서 뒤에 정의한다.
model
1
2
3
4
5
6
7
8
9
10
11
12
13
14
15
16
17
18
19
20
21
22
23
24
25
26
27
28
29
30
31
32
33
34
35
36
37
38
39
40
41
42
| """
model reference : https://www.kaggle.com/drobchak1988/blood-cell-images-acc-92-val-acc-90
"""
bnmomemtum=0.85
def fire(x, squeeze, expand):
y = Conv2D(filters=squeeze, kernel_size=1, activation='relu', padding='same')(x)
y = BatchNormalization(momentum=bnmomemtum)(y)
y1 = Conv2D(filters=expand//2, kernel_size=1, activation='relu', padding='same')(y)
y1 = BatchNormalization(momentum=bnmomemtum)(y1)
y3 = Conv2D(filters=expand//2, kernel_size=3, activation='relu', padding='same')(y)
y3 = BatchNormalization(momentum=bnmomemtum)(y3)
return concatenate([y1, y3])
def fire_module(squeeze, expand):
return lambda x: fire(x, squeeze, expand)
x = Input(shape=image_shape)
y = BatchNormalization(center=True, scale=False)(x)
y = Activation('relu')(y)
y = Conv2D(kernel_size=5, filters=12, padding='same', use_bias=True, activation='relu')(x)
y = BatchNormalization(momentum=bnmomemtum)(y)
y = fire_module(12, 24)(y)
y = MaxPooling2D(pool_size=2)(y)
y = fire_module(24, 48)(y)
y = MaxPooling2D(pool_size=2)(y)
y = fire_module(32, 64)(y)
y = MaxPooling2D(pool_size=2)(y)
y = fire_module(24, 48)(y)
y = MaxPooling2D(pool_size=2)(y)
y = fire_module(18, 36)(y)
y = MaxPooling2D(pool_size=2)(y)
y = fire_module(12, 24)(y)
y = GlobalAveragePooling2D()(y)
y = Dense(4, activation='softmax')(y)
|
모델을 정의하는 부분은 kaggle kernel에서 참조하여 가지고 왔다. 얼핏 보면 base가 SqueezeNet이다.
model summary
1
2
3
4
| from keras.models import Model
model = Model(x, y)
model.summary()
|
summary함수를 호출하면 model의 구조를 한눈에 볼수 있다.
model complie
1
2
3
4
5
| adam = Adam(lr=lr, decay=0.0001)
model.compile(optimizer=adam,
loss='categorical_crossentropy',
metrics=['accuracy'])
|
image preprocessing
1
2
3
4
5
6
7
| train_generator = ImageDataGenerator(
rescale=1./255,
)
test_generator = ImageDataGenerator(
rescale=1./255,
)
|
여기서 image augmentation도 함께 진행할 수 있지만 여기서는 사용하지 않고 scale만 조절한다.
data loader
1
2
3
4
5
6
7
8
9
10
11
12
13
| train_data = train_generator.flow_from_directory(train_img_path,
color_mode='rgb',
batch_size=batch_size,
target_size=(image_shape[0], image_shape[1]),
shuffle=True,
class_mode = "categorical")
test_data = test_generator.flow_from_directory(test_img_path,
color_mode='rgb',
batch_size=batch_size,
target_size=(image_shape[0], image_shape[1]),
shuffle=True,
class_mode = "categorical")
|
매번 데이터를 ImageDataGenerator를 이용해서 호출하기 위해서 loader를 만든다.(train, valid)
- color_mode : rgb color
- target_size : input image size를 조절한다.
- shuffle : image random shuffle
learning rate scheduler
1
2
3
4
5
6
7
8
| def step_decay(epoch):
initial_lrate = 0.1
drop = 0.5
epochs_drop = 10.0
lrate = initial_lrate * math.pow(drop, math.floor((1+epoch)/epochs_drop))
return lrate
lrate=LearningRateScheduler(step_decay)
|
매 epoch마다 learning rate를 조절하기 위한 callback함수를 만든다.
Train
1
2
3
4
5
6
| history = model.fit_generator(train_data,
steps_per_epoch=train_data.n // train_data.batch_size,
epochs=epochs,
validation_data=test_data,
validation_steps=test_data.n // test_data.batch_size,
callbacks=[lrate])
|
학습을 진행한다. Colab의 GPU를 이용하기 때문에 꽤 빠르다. epoch수를 줄여도 꽤 좋은 결과가 나올 것이다.
Graph
1
2
3
4
5
6
7
8
9
10
11
12
13
14
15
16
17
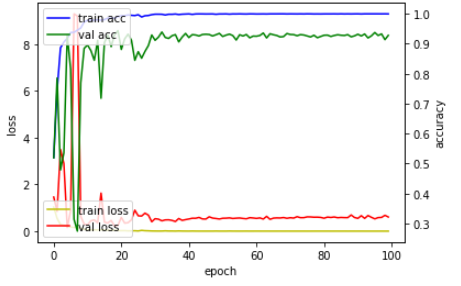
| import matplotlib.pyplot as plt
fig, loss = plt.subplots()
acc = loss.twinx()
loss.plot(history.history['loss'], 'y', label='train loss')
loss.plot(history.history['val_loss'], 'r', label='val loss')
loss.set_xlabel('epoch')
loss.set_ylabel('loss')
loss.legend(loc='lower left')
acc.plot(history.history['acc'], 'b', label='train acc')
acc.plot(history.history['val_acc'], 'g', label='val acc')
acc.set_ylabel('accuracy')
acc.legend(loc='upper left')
plt.show()
|
Test
1
| model.evaluate_generator(test_data, steps=test_data.n // test_data.batch_size)
|
loss가 적고 accuracy는 높게 나온다!
model save
1
| model.save_weights("model.h5")
|
model을 저장한다.
model load
1
| model.load_weights("model.h5")
|
model을 불러온다.
CAM
- Class Activation Mapping
- 설명 : Here
Source Code
1
| class_weights = model.layers[-1].get_weights()[0]
|
softmax로 들어오는 weights를 가져온다.
1
2
3
| layer_dict = dict([(layer.name, layer) for layer in model.layers])
print(layer_dict)
|
layer를 확인한다. GlobalAveragePooling을 하기 전에 output을 가져와야하기 때문에 layer_dict로 이름을 확인한뒤 가져와야한다.
1
| final_conv = layer_dict['concatenate_6']
|
마지막 layer의 이름이 concatenate_6이었다.
1
2
3
| import keras.backend as K
get_output = K.function([model.layers[0].input], [final_conv.output, model.layers[-1].output])
|
마지막 layer의 output과 예측 layer의 output을 가져온다.
1
2
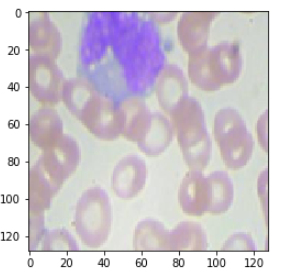
| img_path = os.path.join(test_simple_img_path ,'MONOCYTE//_1_4511.jpeg')
# MONOCYTE : 2
|
테스트 할 이미지를 불러온다.
1
2
3
4
5
| img = cv2.imread(img_path)
img = cv2.cvtColor(img, cv2.COLOR_BGR2RGB)
img = cv2.resize(img, (128, 128))
plt.imshow(img)
|
이미지를 확인한다.
1
| [conv_outputs, predictions] = get_output([[img / 255.0]])
|
이미지를 모델에 넣고 output을 가져온다.
1
2
| conv_outputs = conv_outputs[0, ...]
conv_outputs = np.transpose(np.float32(conv_outputs), (2,0,1))
|
weights의 shape을 맞추어 주기 위해 transpose를 진행한다.
1
2
3
4
5
6
7
8
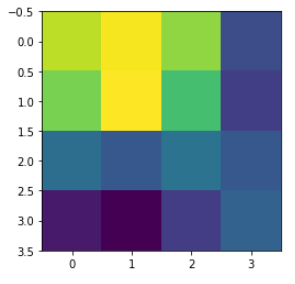
| cam = np.zeros(dtype = np.float32, shape = conv_outputs.shape[1:3])
for i, w in enumerate(class_weights[:, 2]): # 2: class num
cam += w * conv_outputs[i, :, :]
cam = cam - np.min(cam)
cam /= np.max(cam)
plt.imshow(cam)
|
클래스가 2인 MONOCYTE를 잘 예측하는지 보려고 하기 때문에 class_weights[:, 2]을 사용한다.
1
2
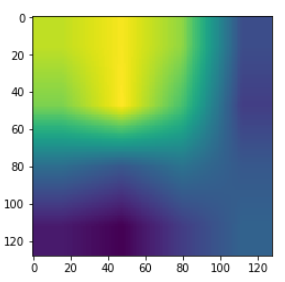
| cam = cv2.resize(cam, (128, 128))
plt.imshow(cam)
|
1
2
3
4
| heatmap = cv2.applyColorMap(np.uint8(255*cam), cv2.COLORMAP_JET)
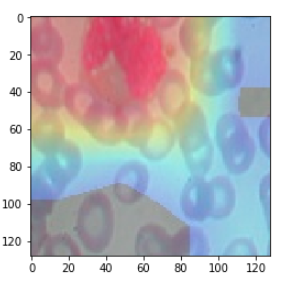
heatmap[np.where(cam < 0.2)] = 0
img = heatmap*0.3 + img*0.7
cv2.imwrite('./cam.jpg', img)
|
이미지 저장하기
1
2
3
| cam_img = cv2.imread('./cam.jpg')
cam_img = cv2.cvtColor(cam_img, cv2.COLOR_BGR2RGB)
plt.imshow(cam_img)
|
Grad CAM
- Gradient Class Activation Mapping
- 설명 : Here
위에 부분에서 특정 부분을 아래와 같이 바꾸면 된다.
1
| y_c = model.output.op.inputs[0][0, 2] # 2: class num
|
1
| get_output = K.function([model.layers[0].input], [final_conv.output, K.gradients(y_c,final_conv.output)[0], model.output])
|
1
| [conv_outputs, grad_val, predictions] = get_output([[img]])
|
1
2
| conv_outputs = conv_outputs[0, ...]
conv_outputs = np.transpose(np.float32(conv_outputs), (2,0,1))
|
1
| grad_cam = np.zeros(dtype = np.float32, shape = conv_outputs.shape[1:3])
|
1
2
3
4
| weights = np.mean(grad_val, axis=(0, 1))
for i, w in enumerate(weights[2,:]): # 2: class num
grad_cam += w * conv_outputs[i, :, :]
|
Reference

